3.02 beta

All
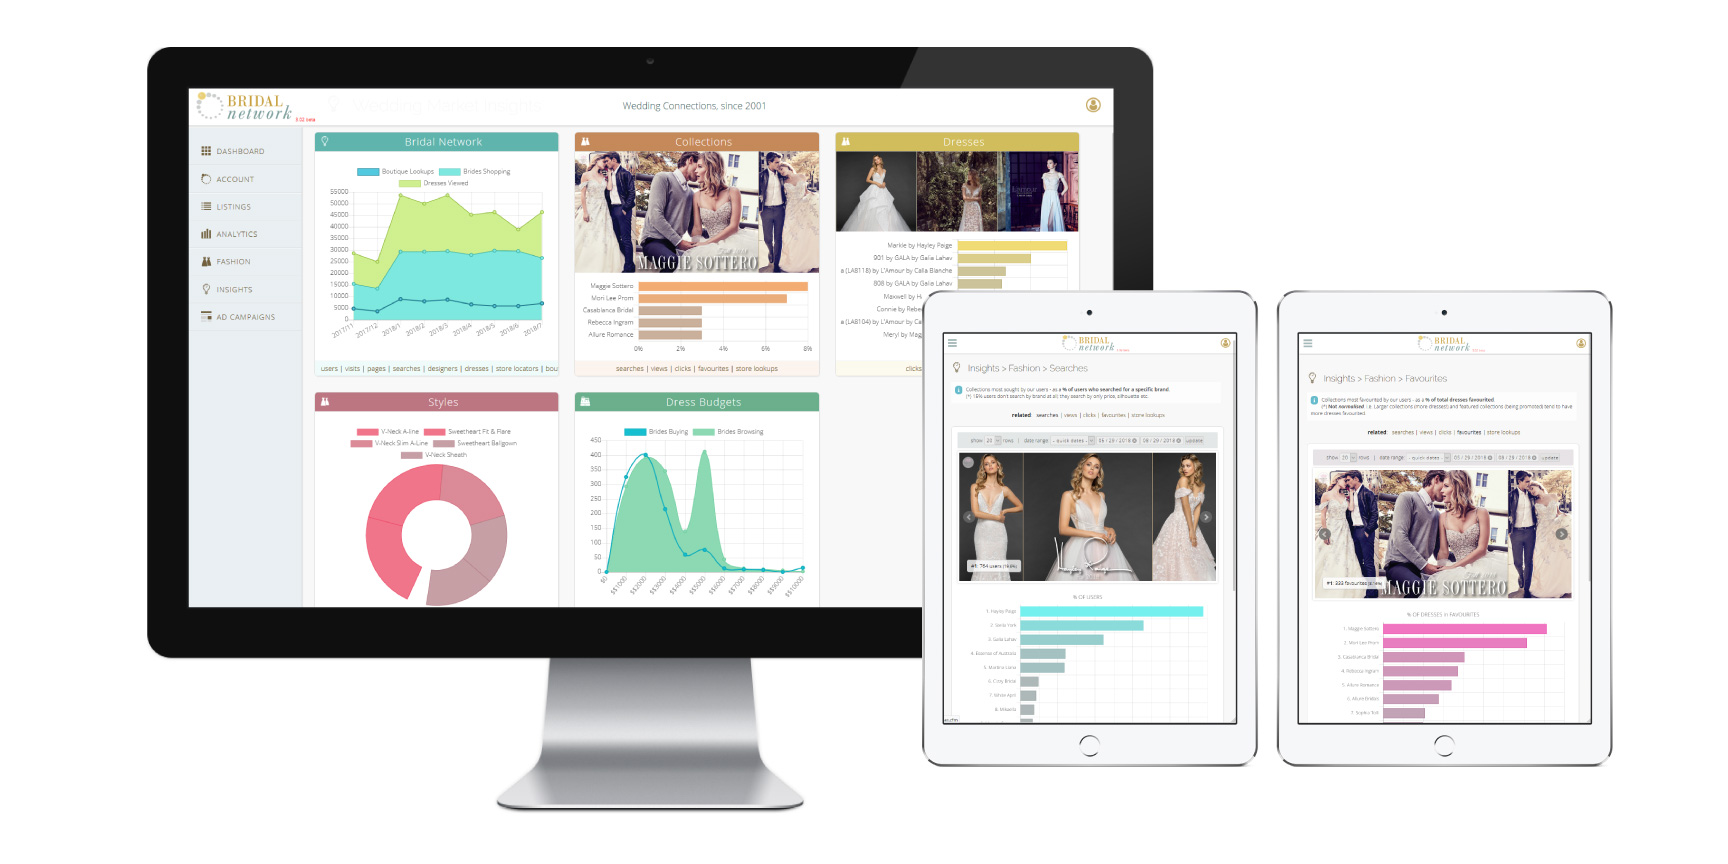
Our premium members can control report options, or request in-depth custom reports on the metrics most important to their business. Some representative examples, below.
{ available to everyone }.
(*) Custom, in-depth reports are also available, upon request, to our premier members. Demographics, geo-targeted trends, comparisons with previous seasons etc.
{ available to boutiques, fashion designers & distributors }.
And how do these trend over time? Is your marketing producing the desired results?
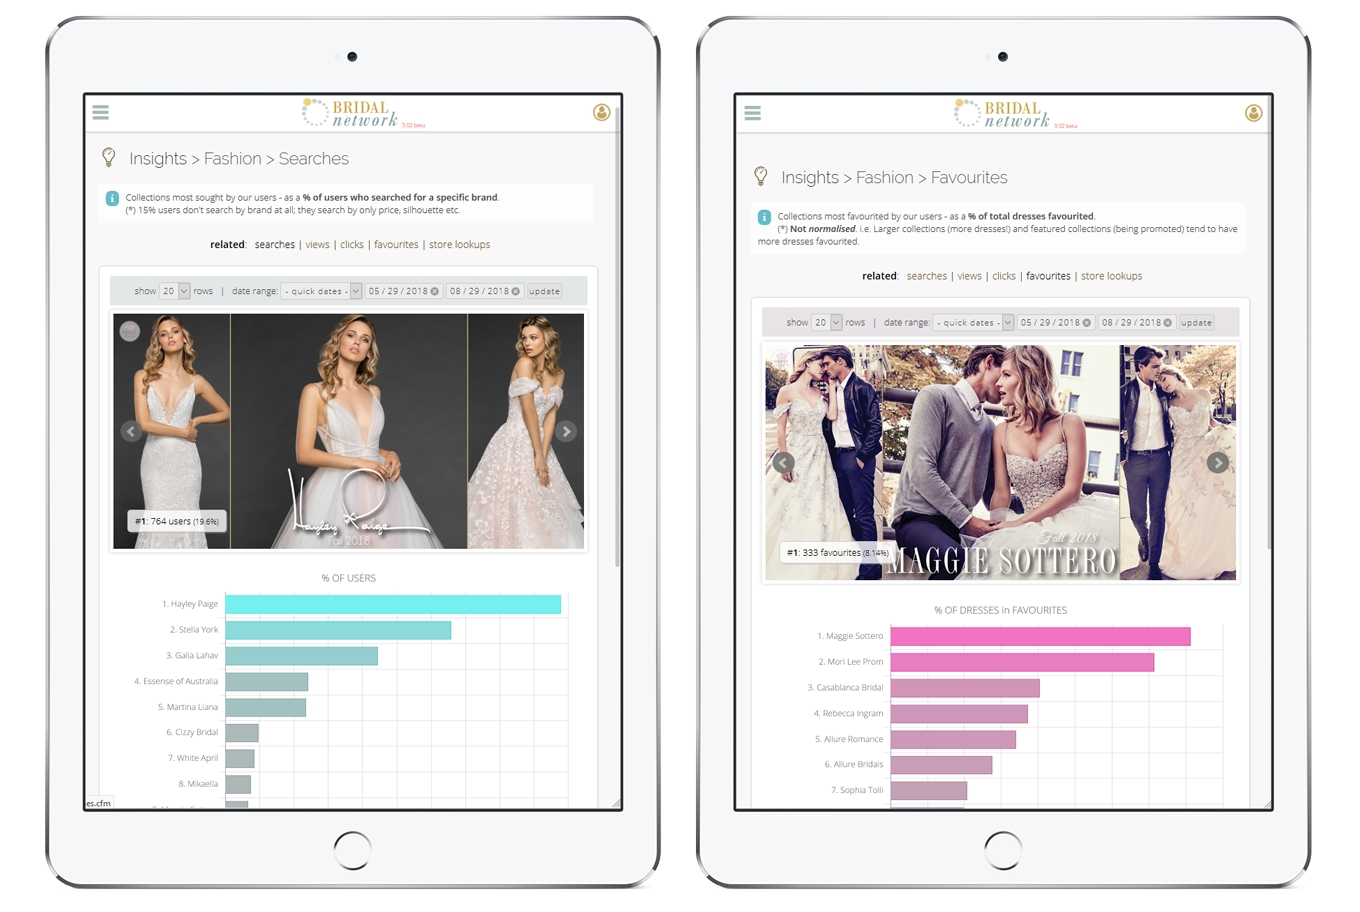
{ available to boutiques, fashion designers & distributors }.
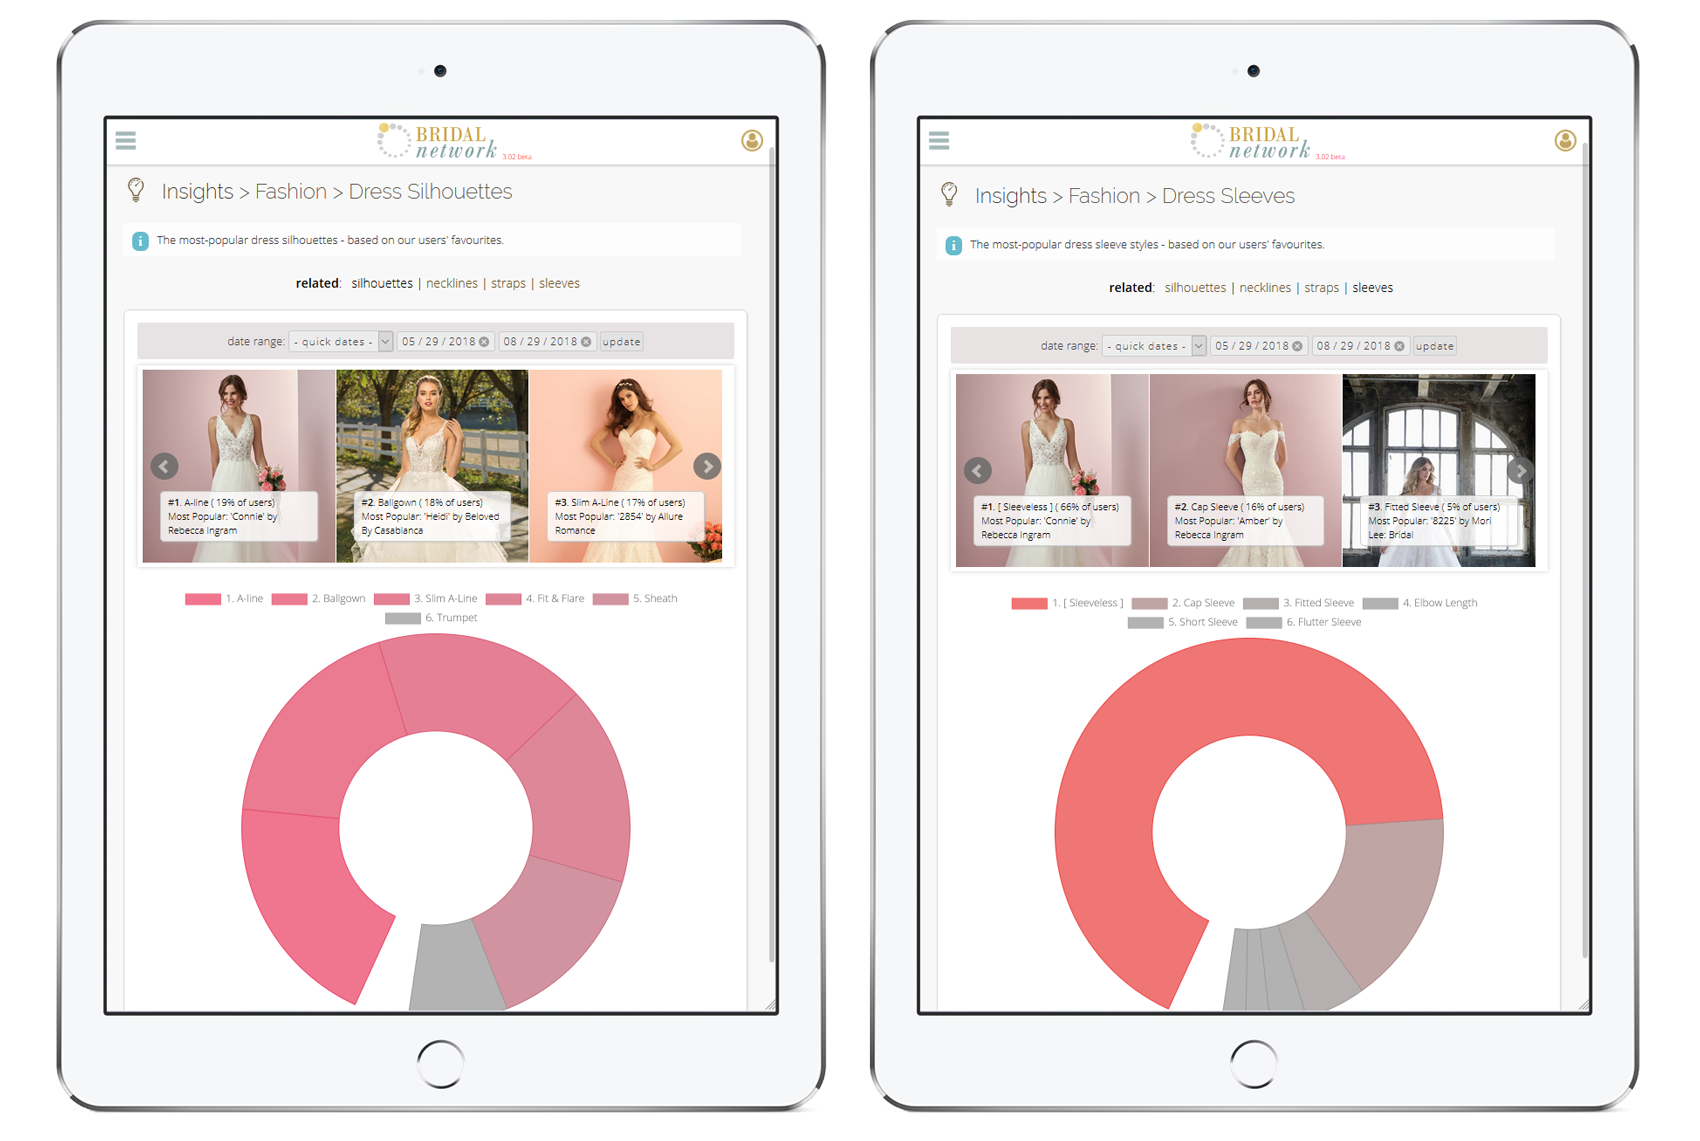
(*) Custom, in-depth reports (eg. strapless fit & flare versus cap sleeve, or which styles are searched versus favourited etc) are also available, upon request, to our premier designer members (see Dressfinder for Designers for details)
{ available to boutiques, fashion designers & distributors }.
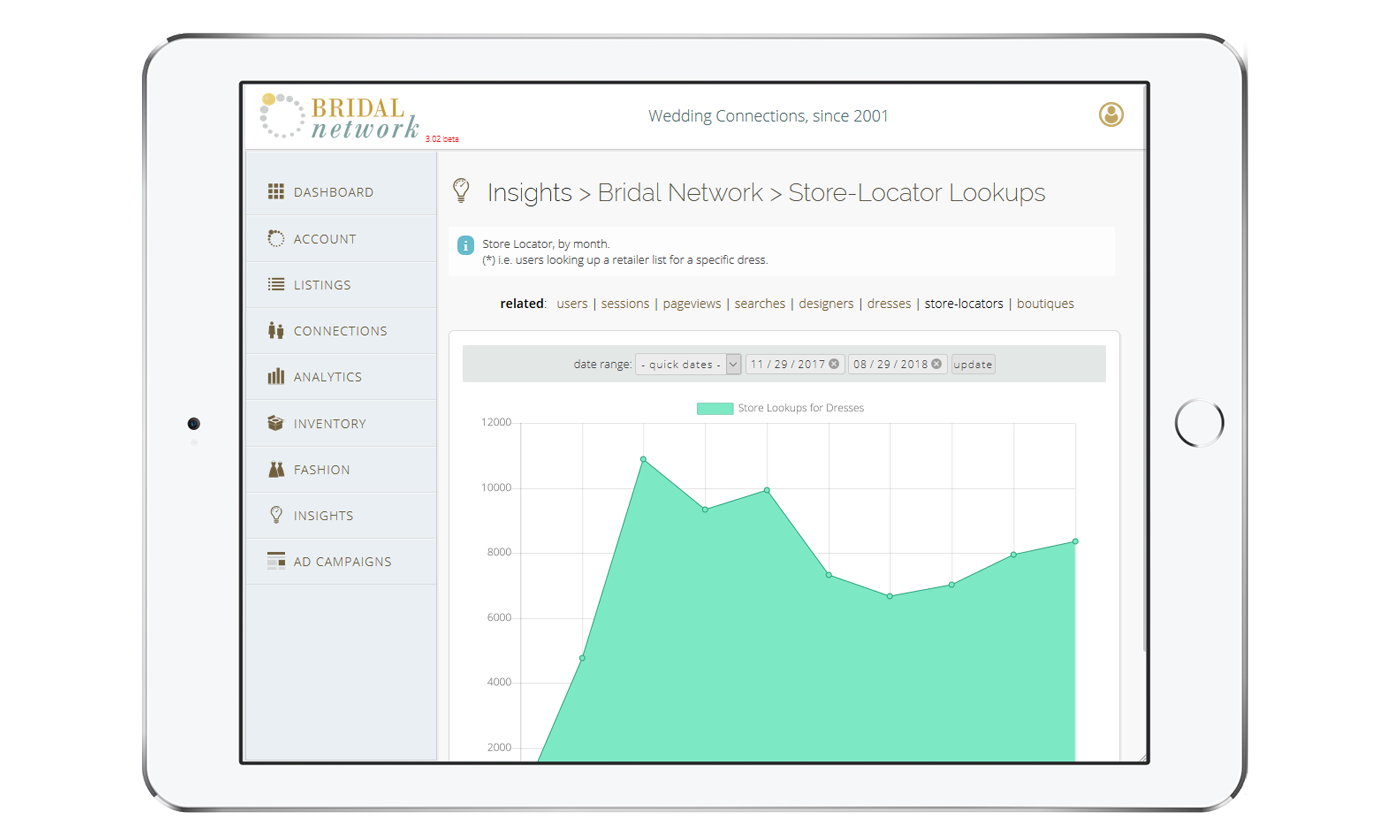
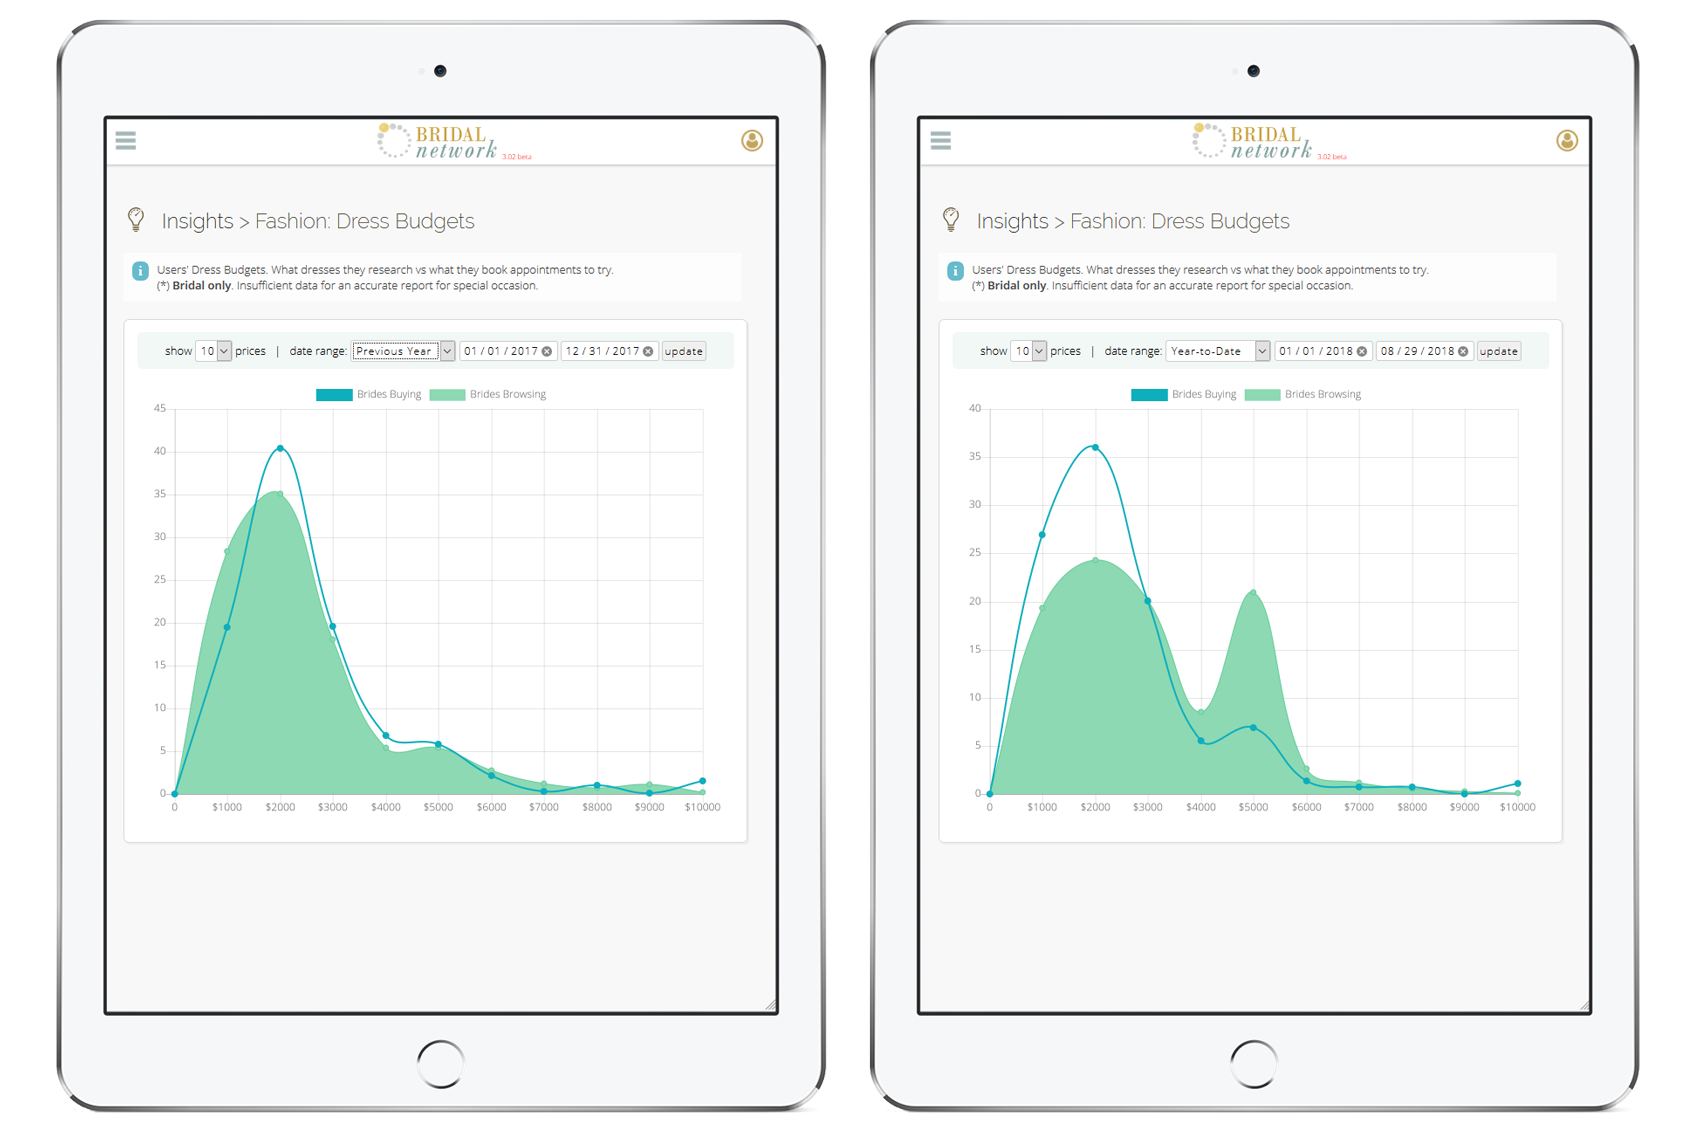
Anticipate your market, plan your stock and your advertising accordingly.
Click the attached image. See that "bump" over the $5,000 mark? That wasn't there the year before. That's good news! Optimism.
|
Please be Patient. |